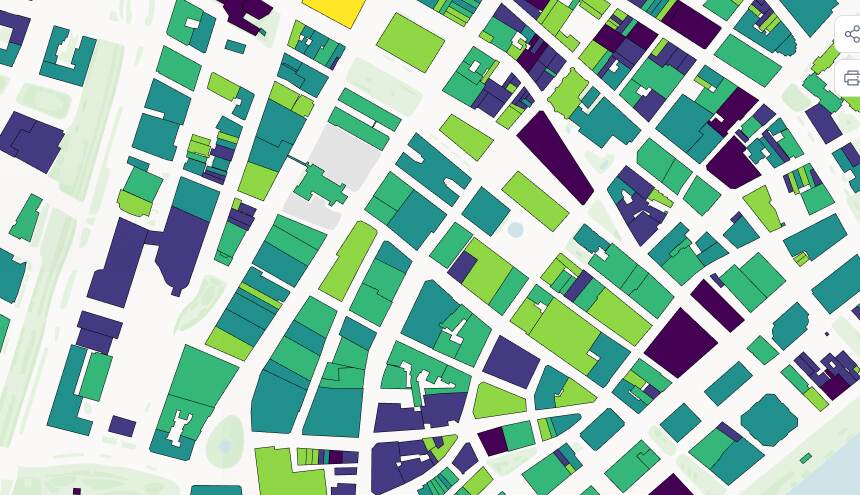
Every dataset in. One link out.
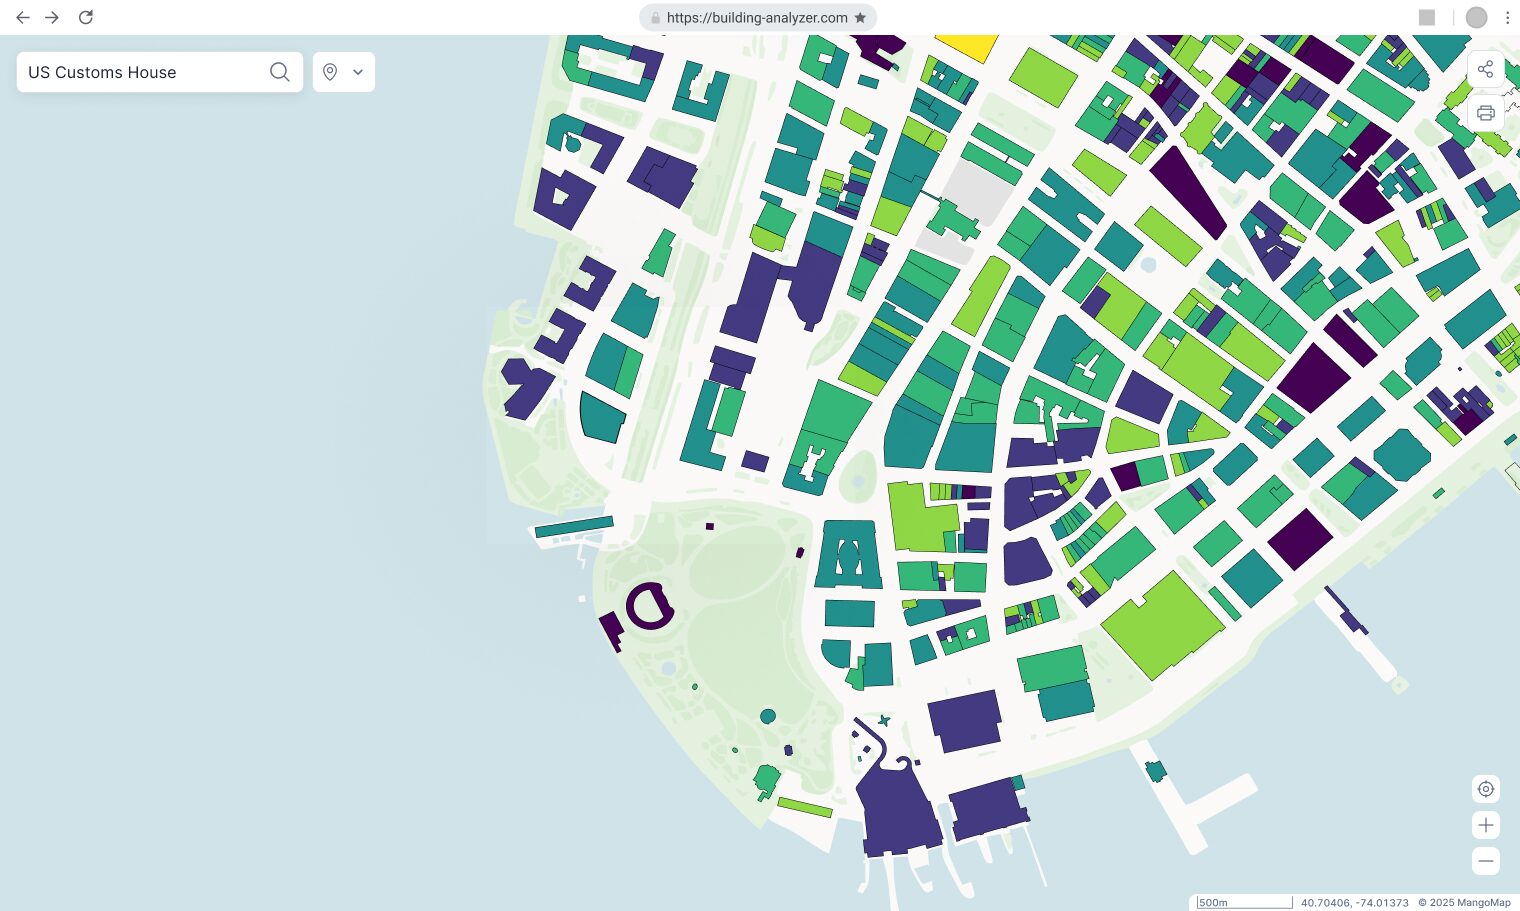
Mango is the publishing layer for finished environmental work. Publish it with no developer, no server, no GIS stack. Funders just open the link in a browser.

“We swapped static PDF reports for a live portal funders can open. It changed how the grant review went.” Used at Ridge to Reefs and EPR.




Publish compelling maps without the overhead or the licence
Turn drone imagery, field data, and open sources into a portal funders can read, on pricing that fits a grant cycle.
Pricing that fits a grant cycle
Fixed, predictable plans you can write into a grant budget and defend to a funder. No metered usage, no costs that move once the project is underway.
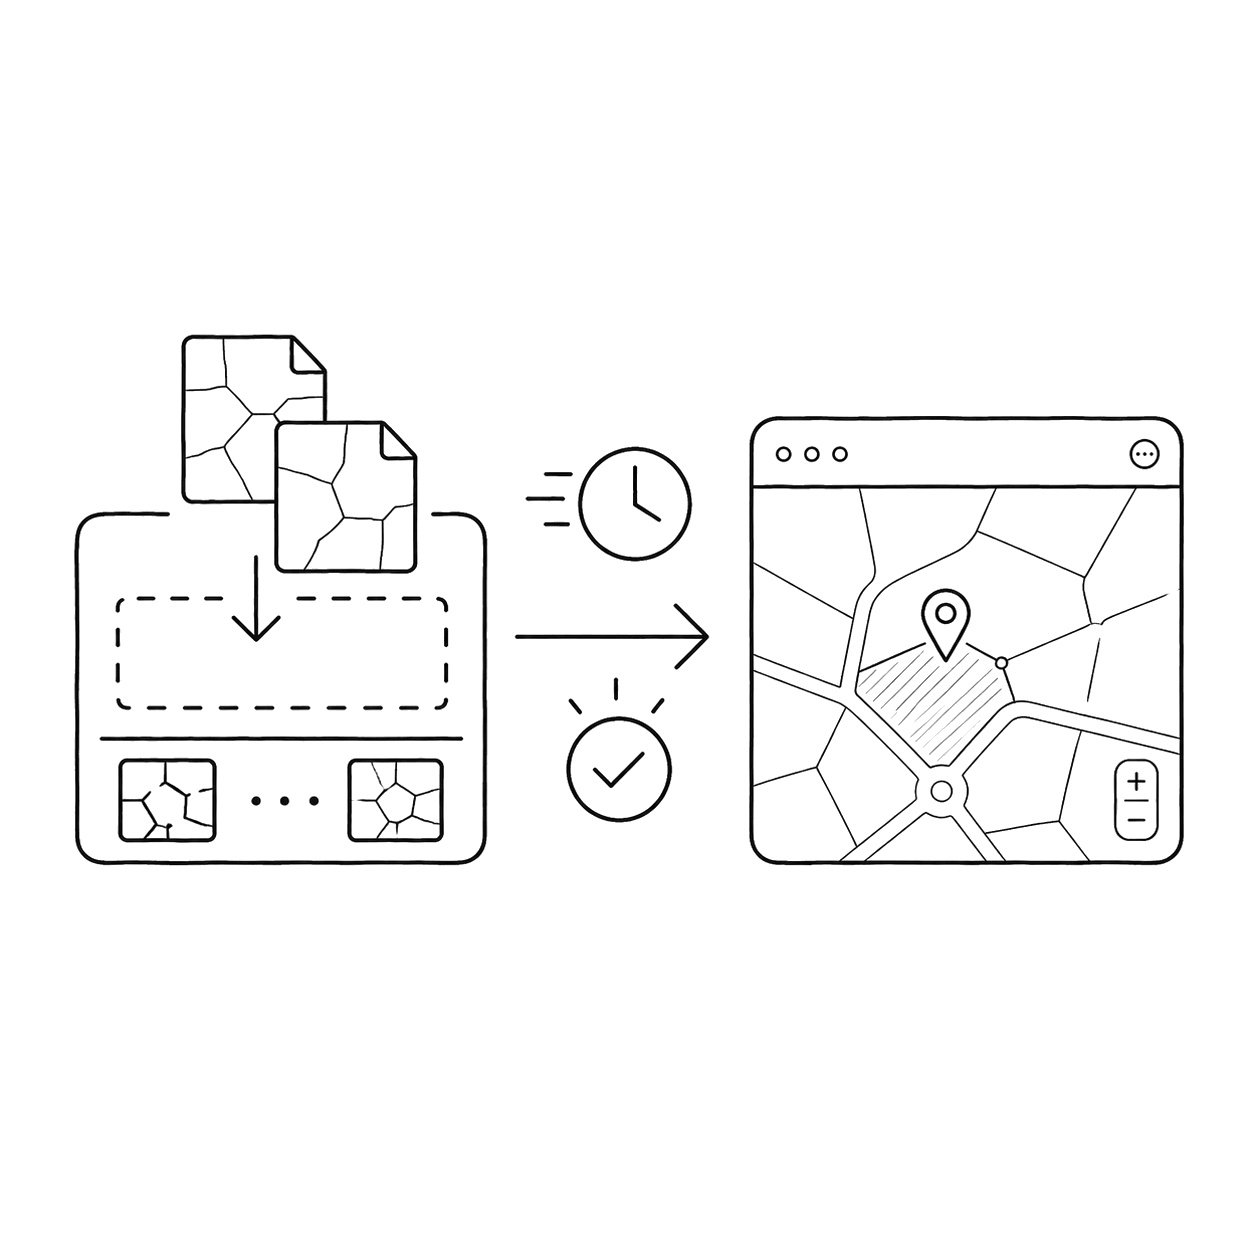
Live in days, not a build cycle
Publish a portal from your finished data without a developer or a web build. The time goes into the science and the fieldwork, not the stack.
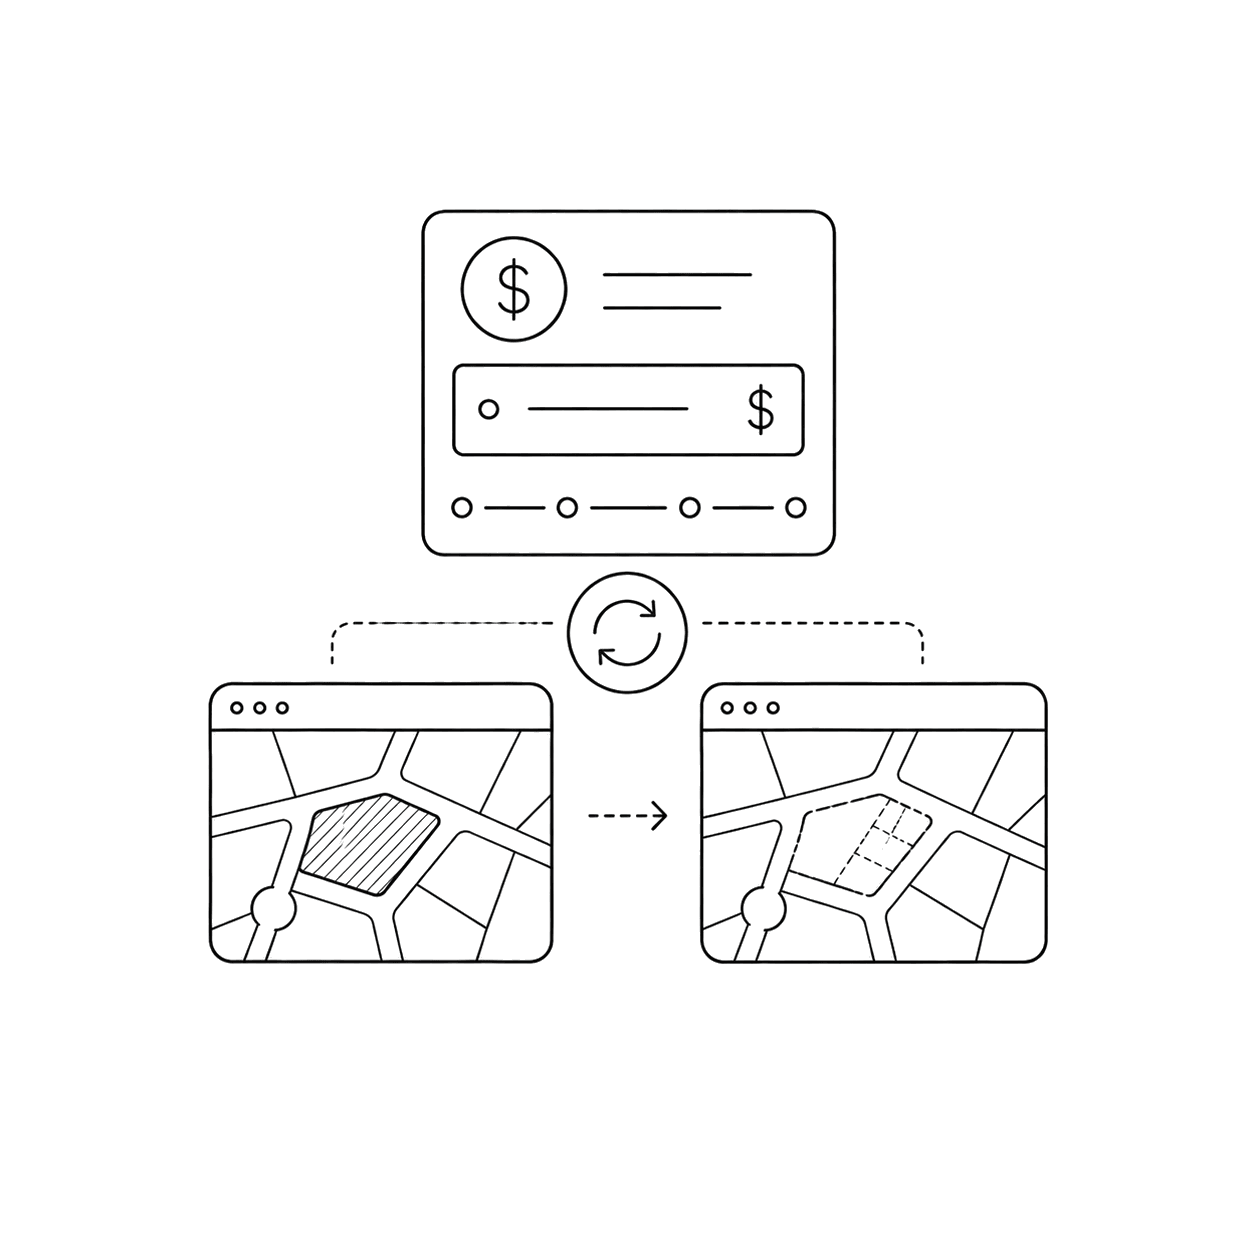
Update across the whole project life
Refresh the portal as new drone flights and field data come in. Funders and clients see the current picture, not last season's snapshot.
Made for the people who fund the work
Funders, clients, and community stakeholders open a link and explore the map themselves. No GIS software, no training, no walkthrough from you.

Environmental teams already doing this with Mango
From sustainability education to urban analytics — real teams, real maps.
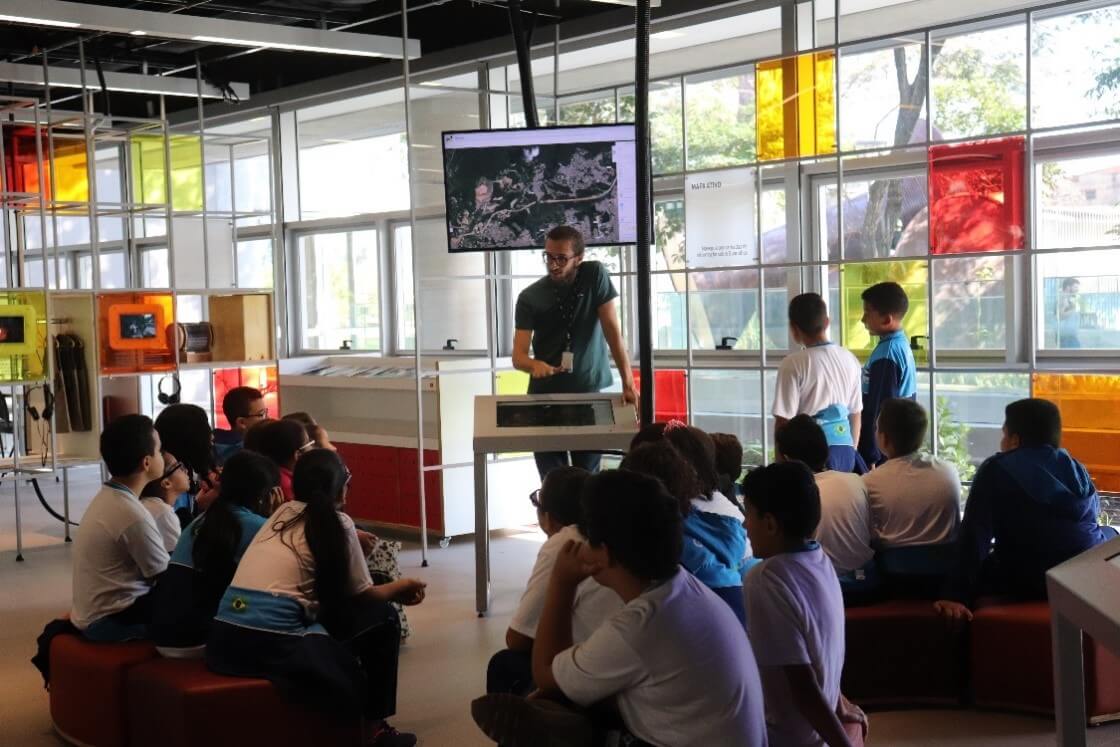
SESC in São Paulo turned georeferenced data into a hands-on sustainability education tool for the community of Guarulhos.
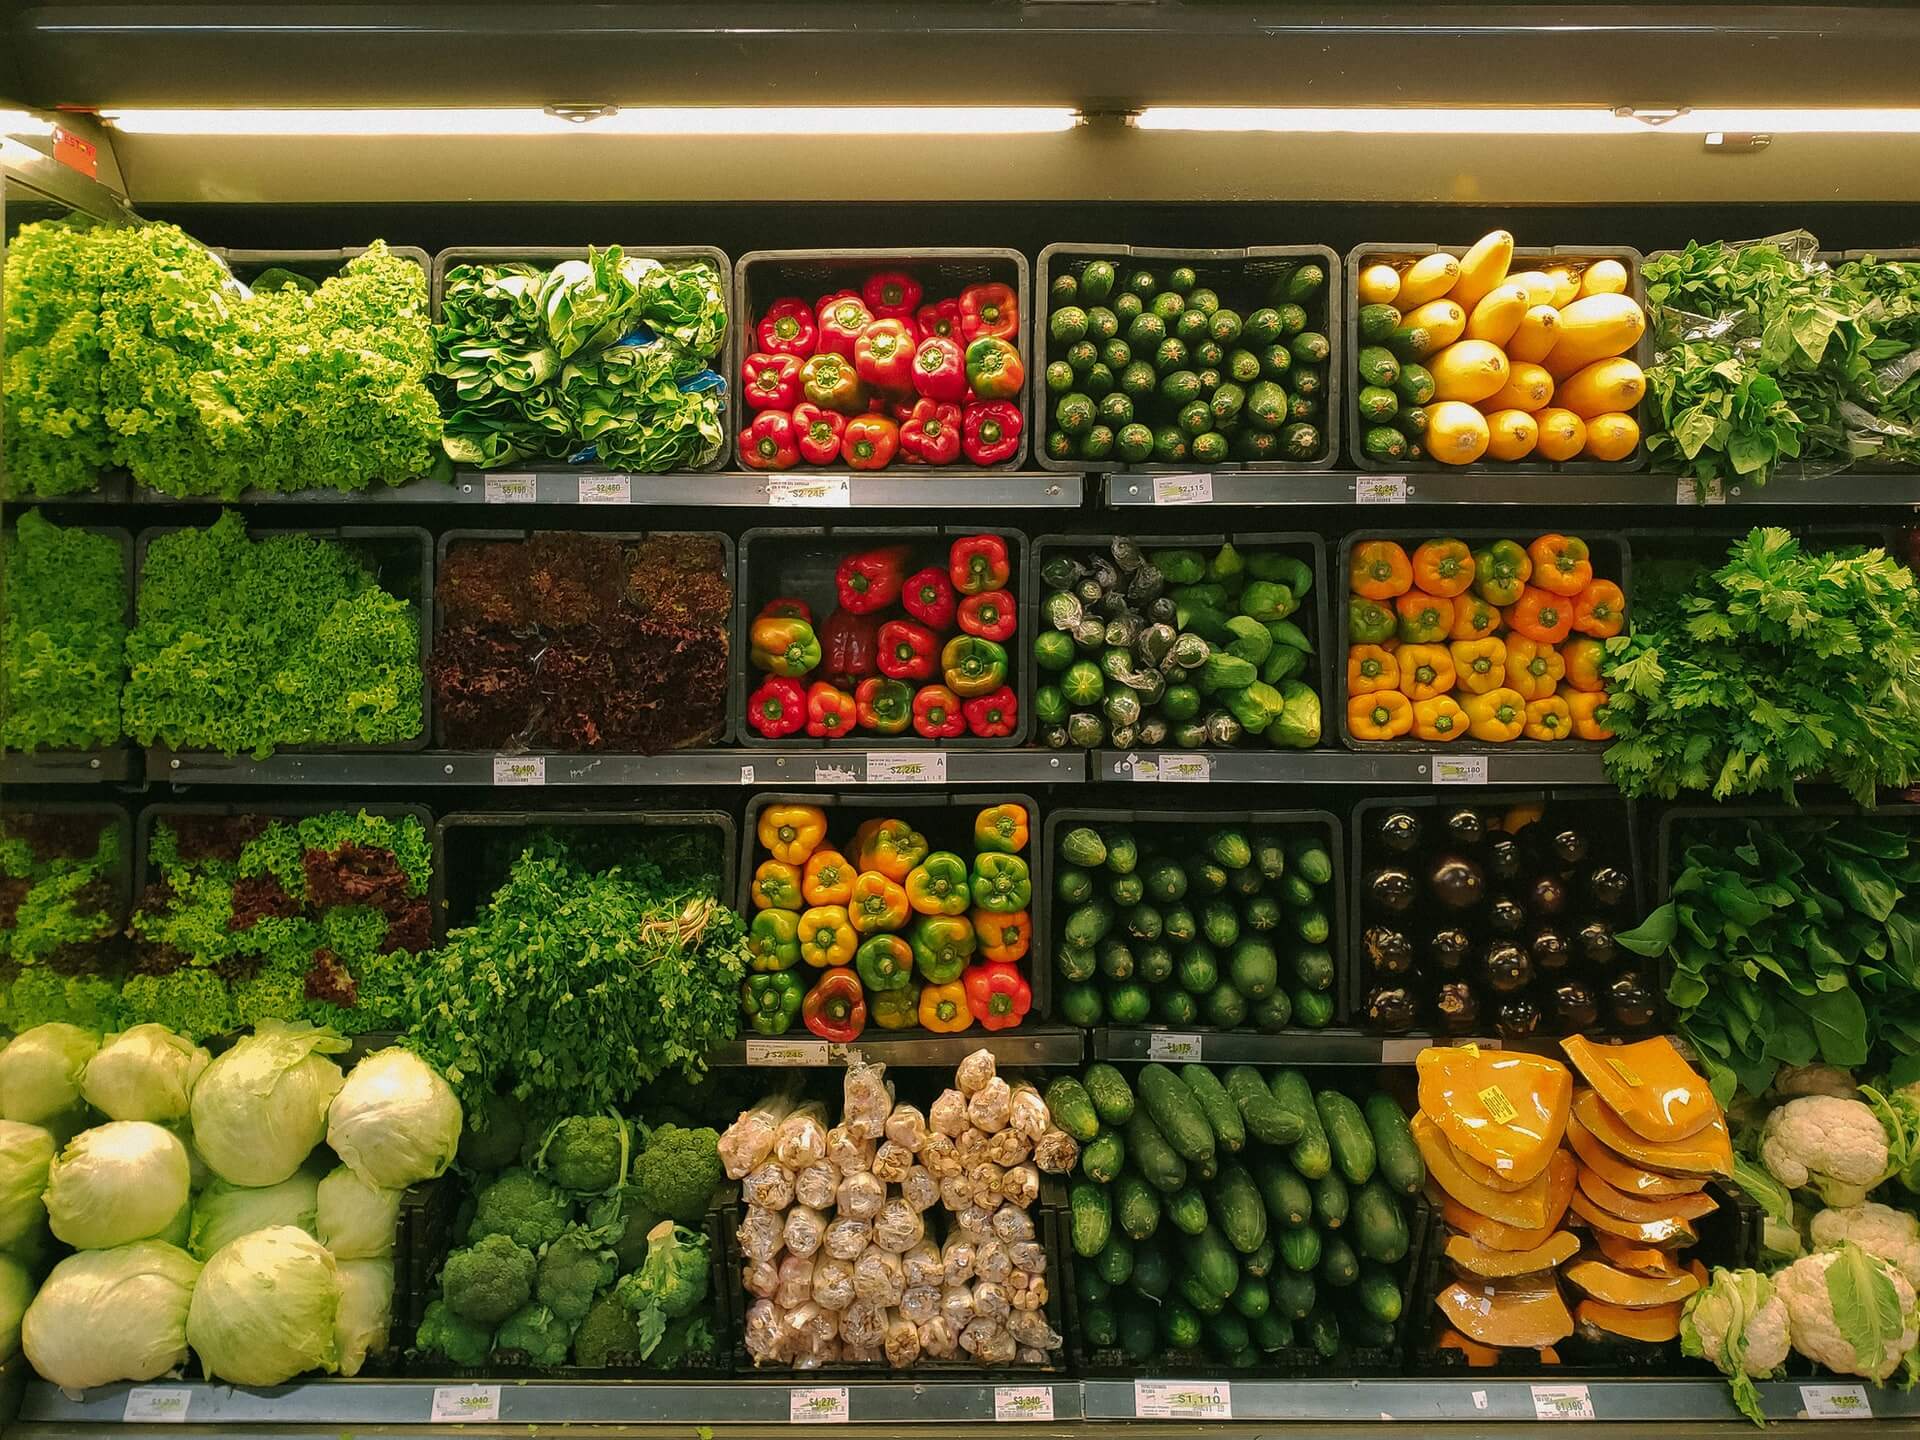
A University of Manitoba team mapped Winnipeg's food deserts, turning socioeconomic data into a story the public could explore.
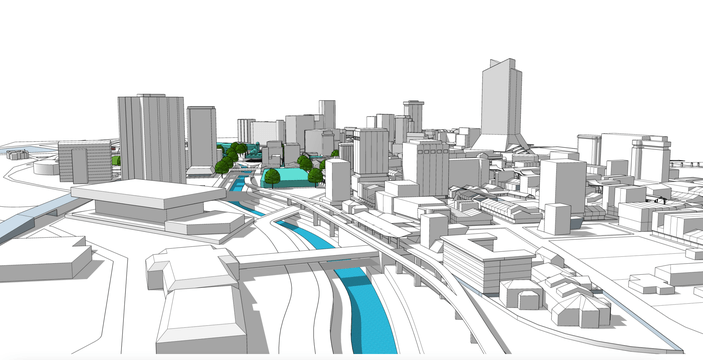
Malaysian urban-impact agency Think City used Mango to open up city data through its public Urban Analytics portal.
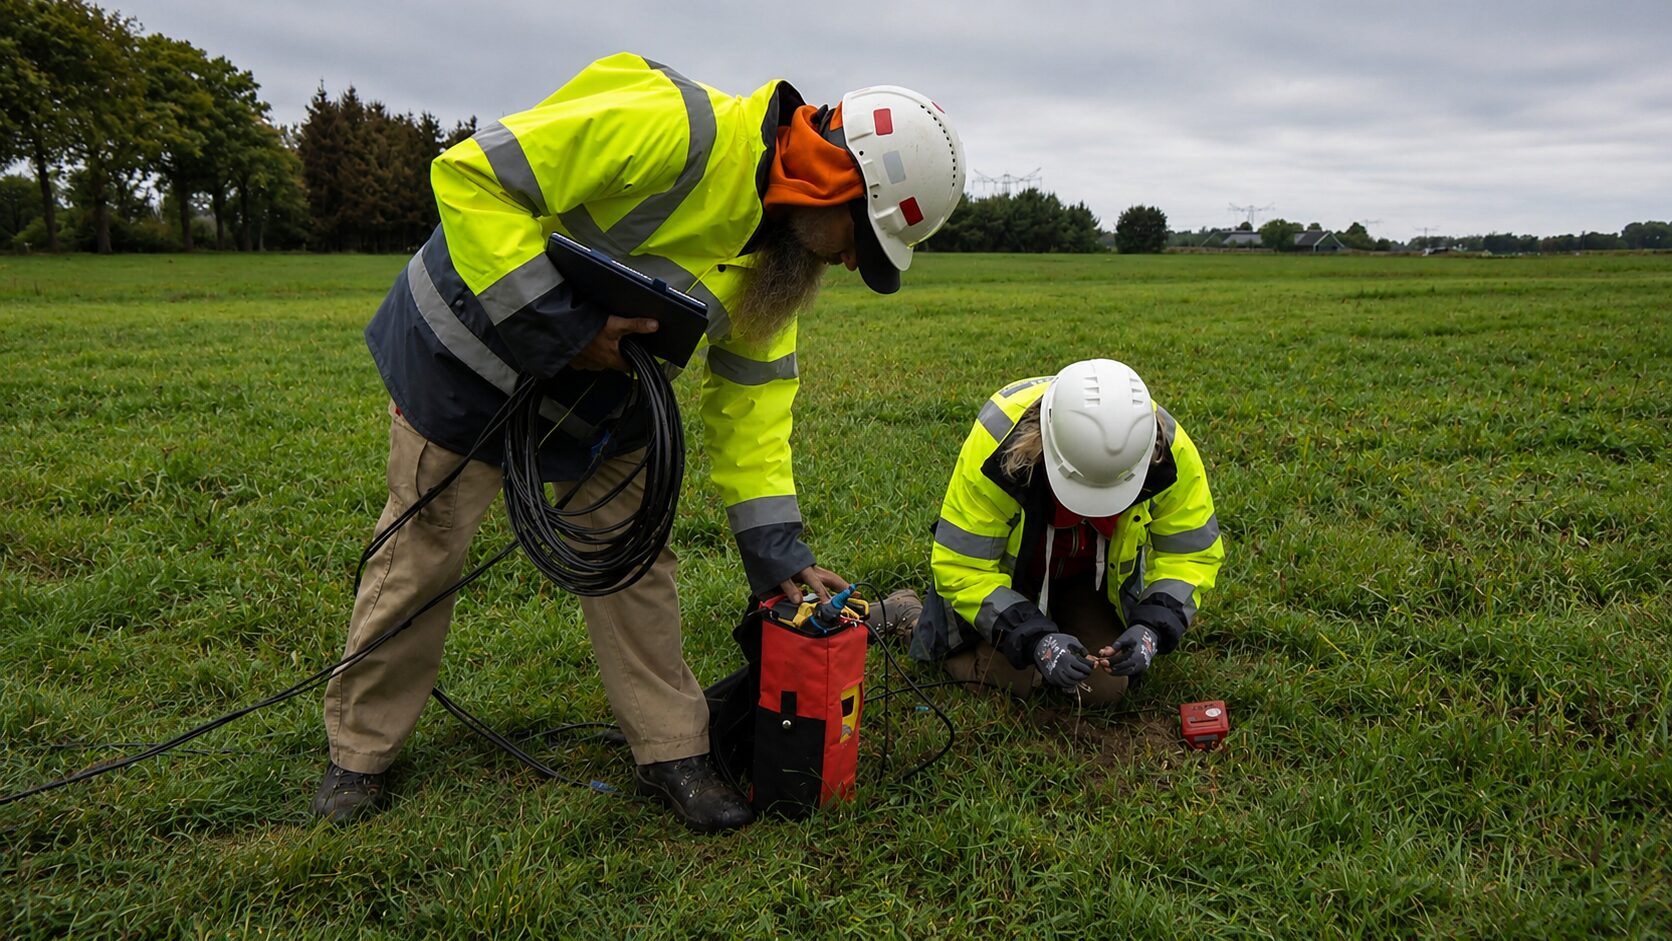
GIS consultancy DavSeis kept Europe's biggest seismic survey — 300 people working nationwide — running from one always-current map.
“We chose Mango for our map visualisation and narrative because of its simplistic and straightforward nature. The interface is light and easy to navigate on desktop or mobile, making it useful to both our on-ground survey teams and the active public.”
Dr. Ceelia Leong
Think City
“With an online tool like Mango, it’s easier to keep a track record of any changes. Everybody can then report to the GIS office and the GIS office can create maps.”
Vlad Cristian Nita
S3 Seismic
“Love Mango... compared to ArcGIS online, it provides better visual mapping and a straightforward pricing model.”
Dr. Chris Green
Snr Epidemiologist, WRHA
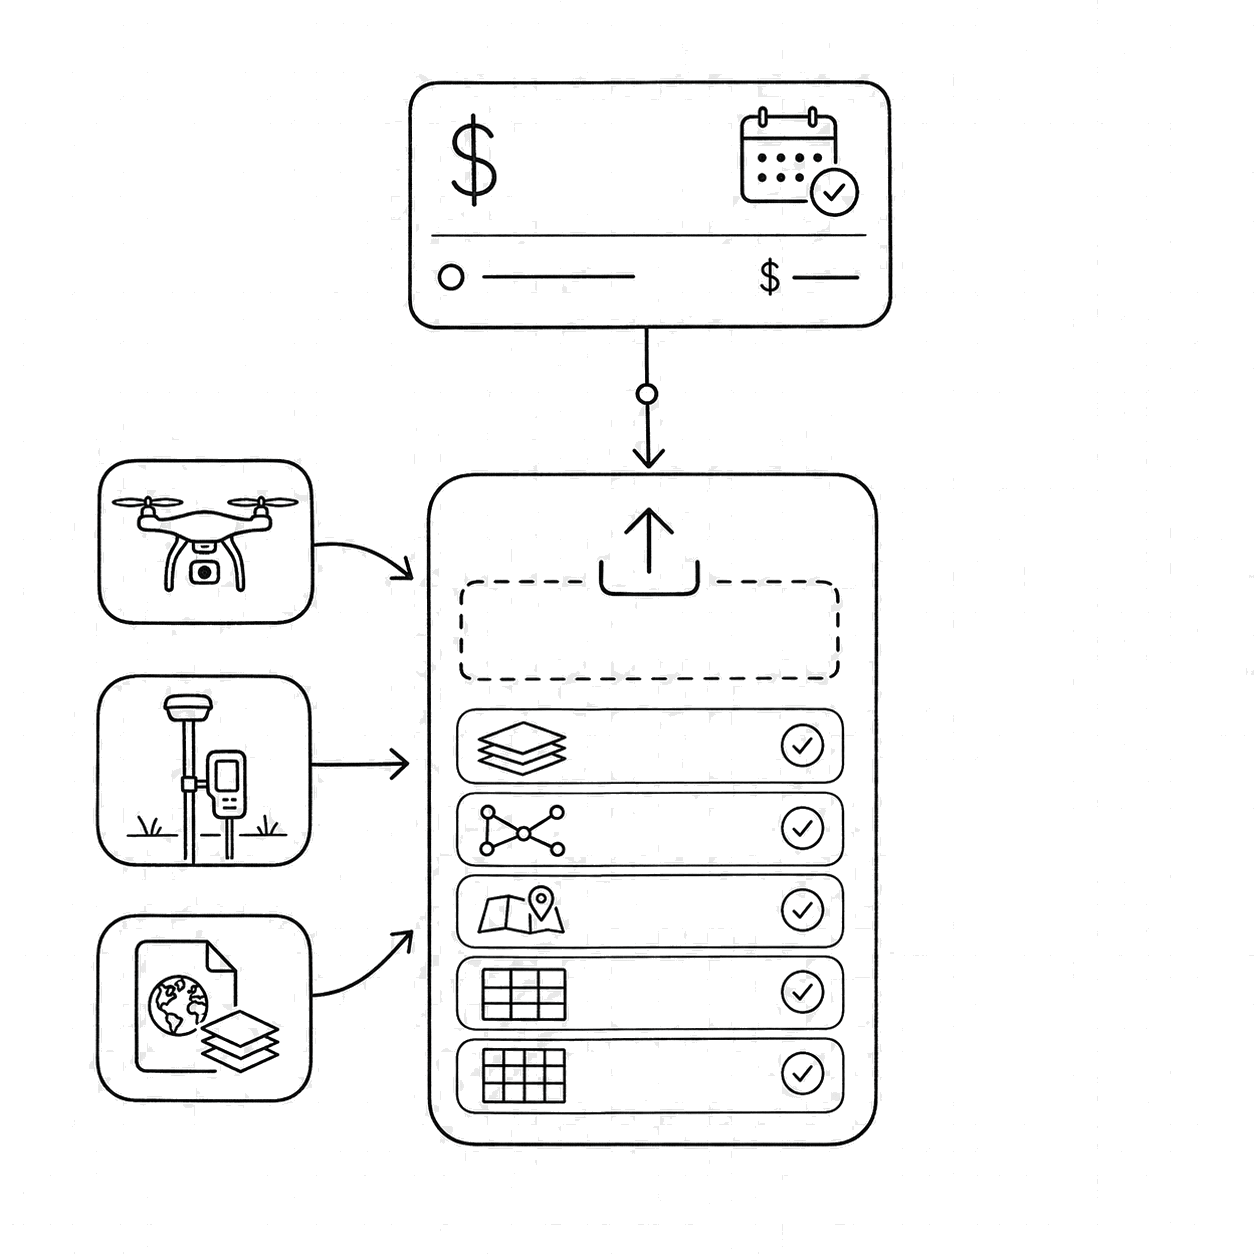
Drop in Shapefile, KML, GeoJSON, CSV, and GeoTIFF. Your drone imagery, field surveys, remote sensing, and open data all come together in one map.
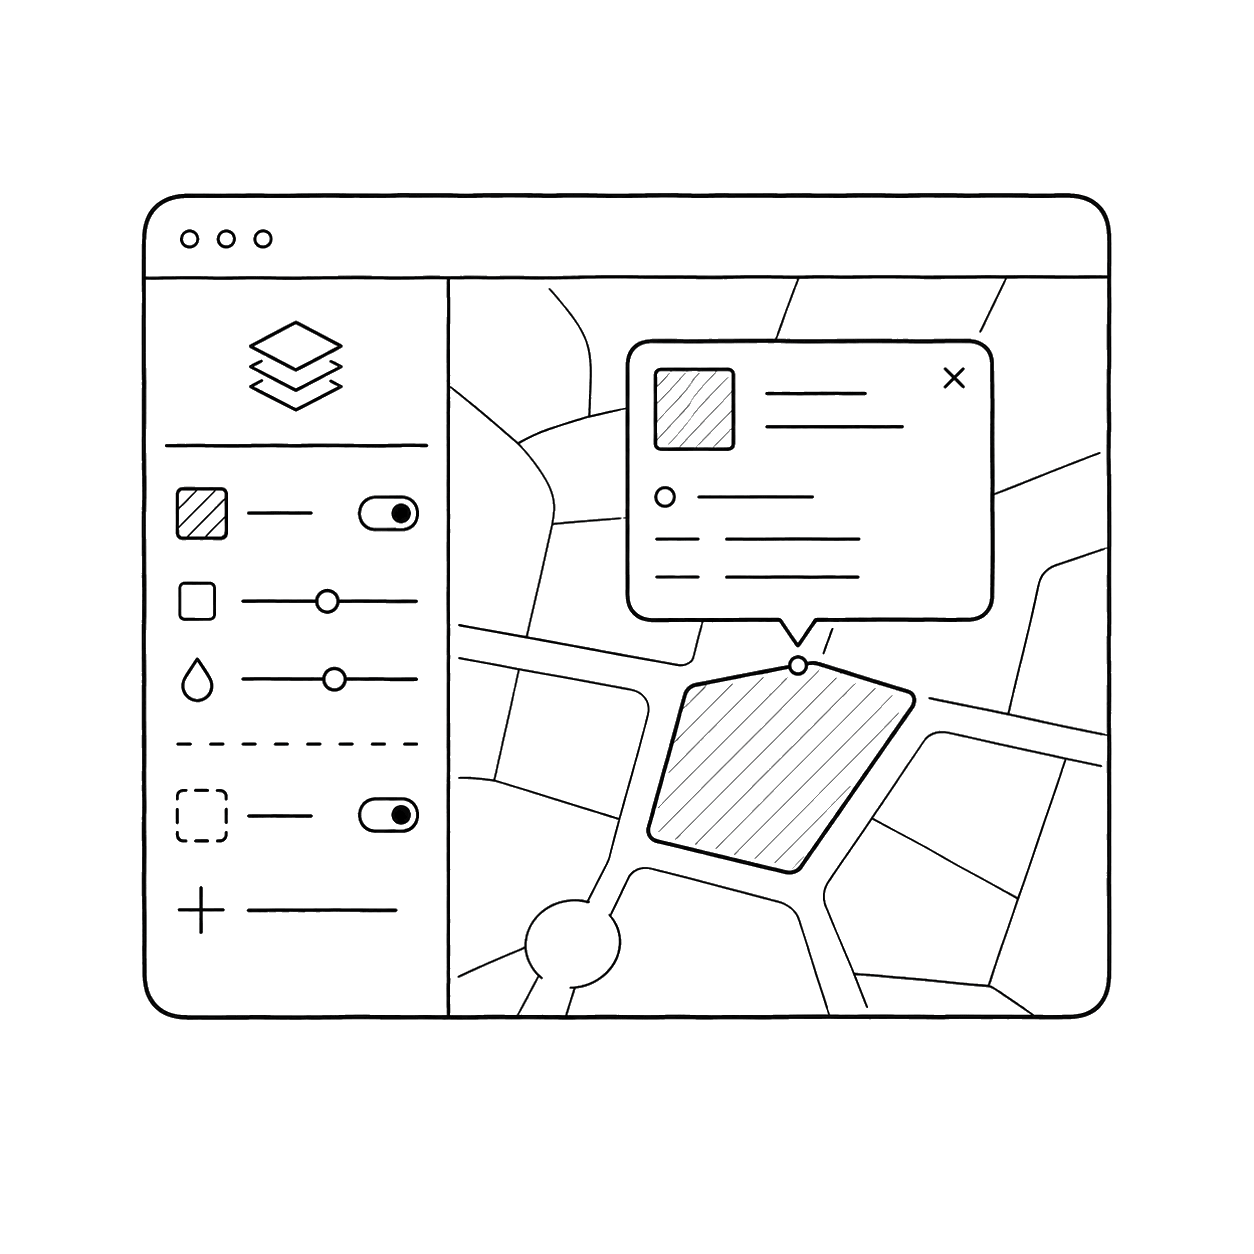
Build it with no-code styling: filters, symbology, and popups. Make a complex dataset legible to someone who is not a GIS analyst.
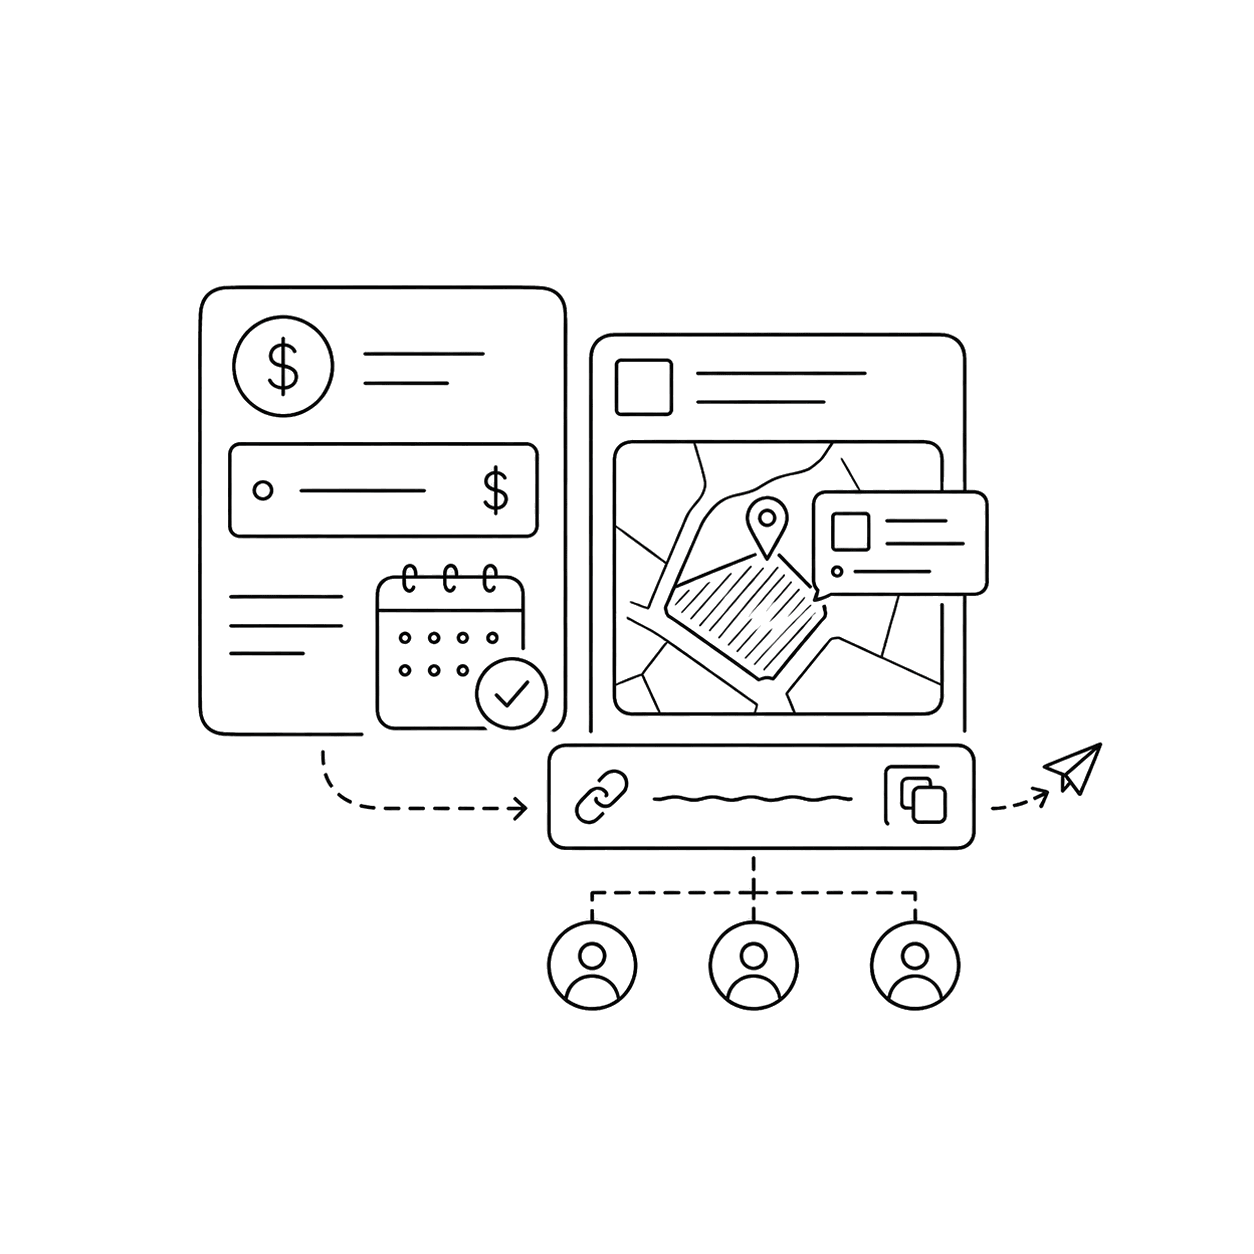
Publish to a link or embed it in your report or site. Funders and clients open it in a browser, with nothing to install.
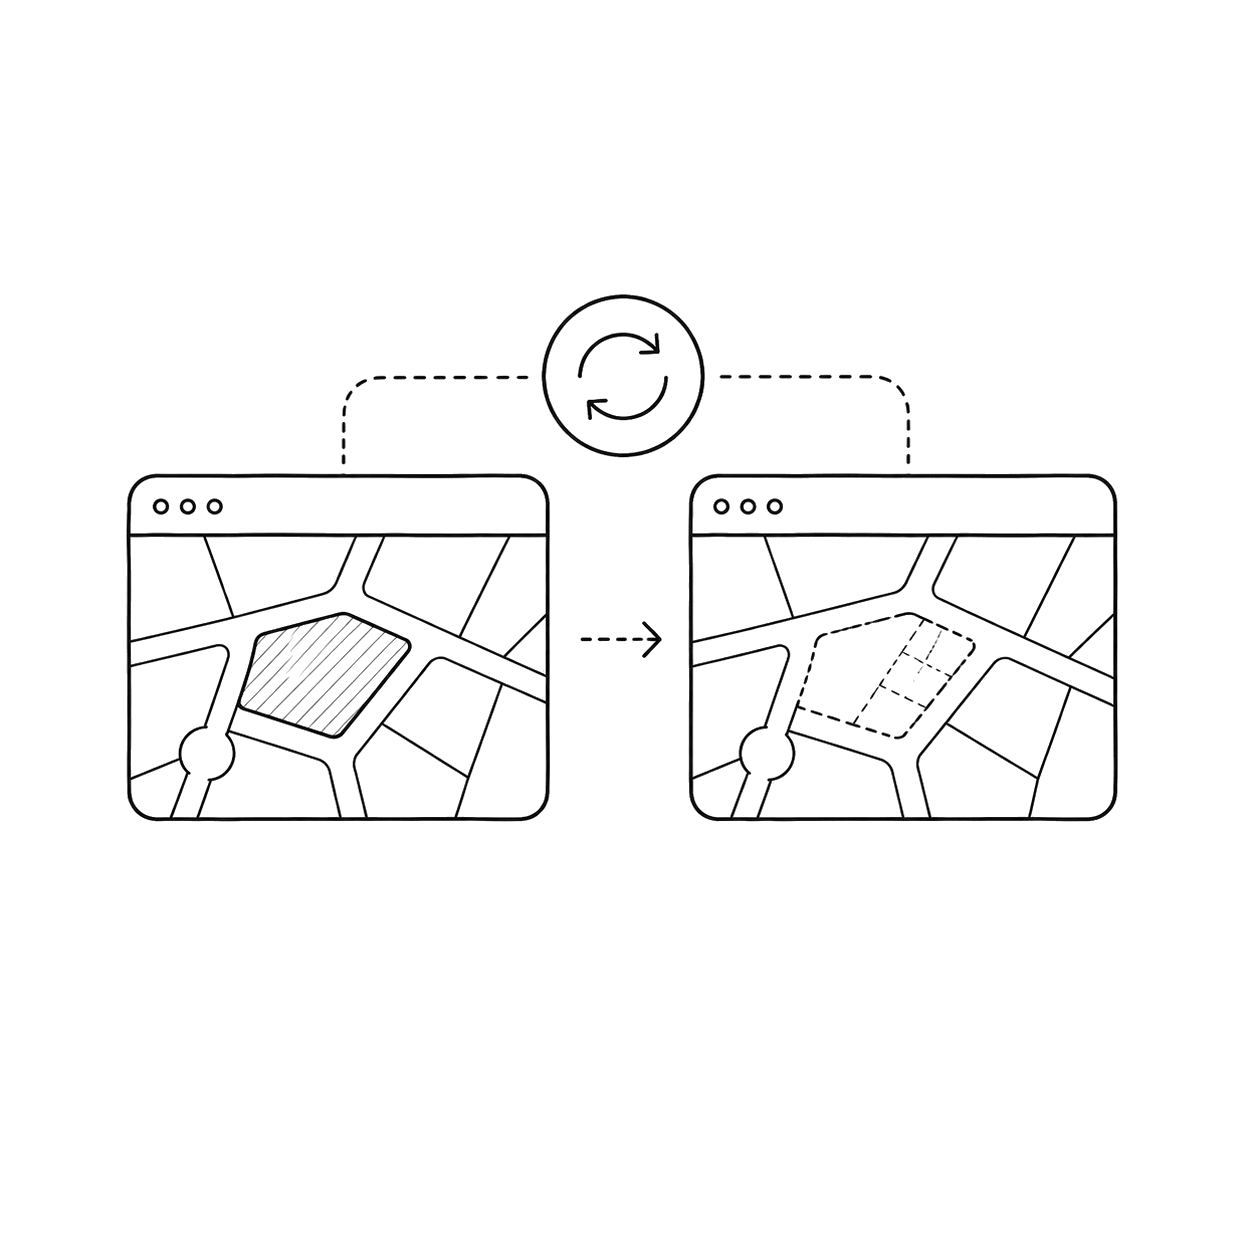
Add new data as the project runs. Every published map updates right away, so stakeholders never see a stale version.
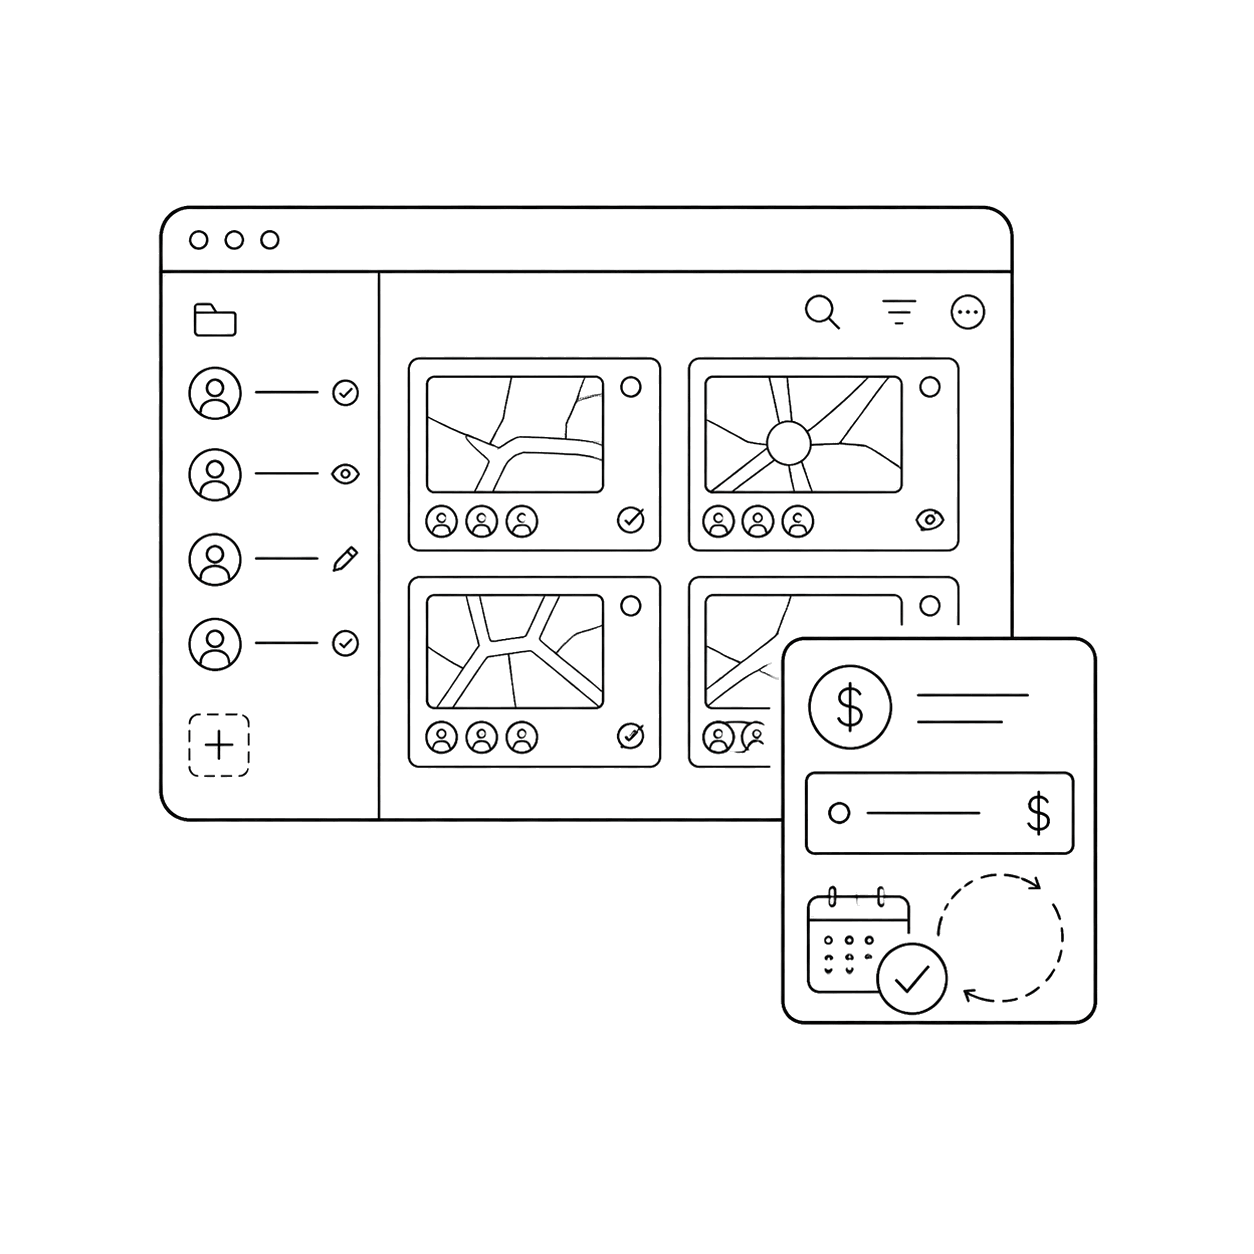
Keep every project and portal in one place. Add your team and set who can see each map.
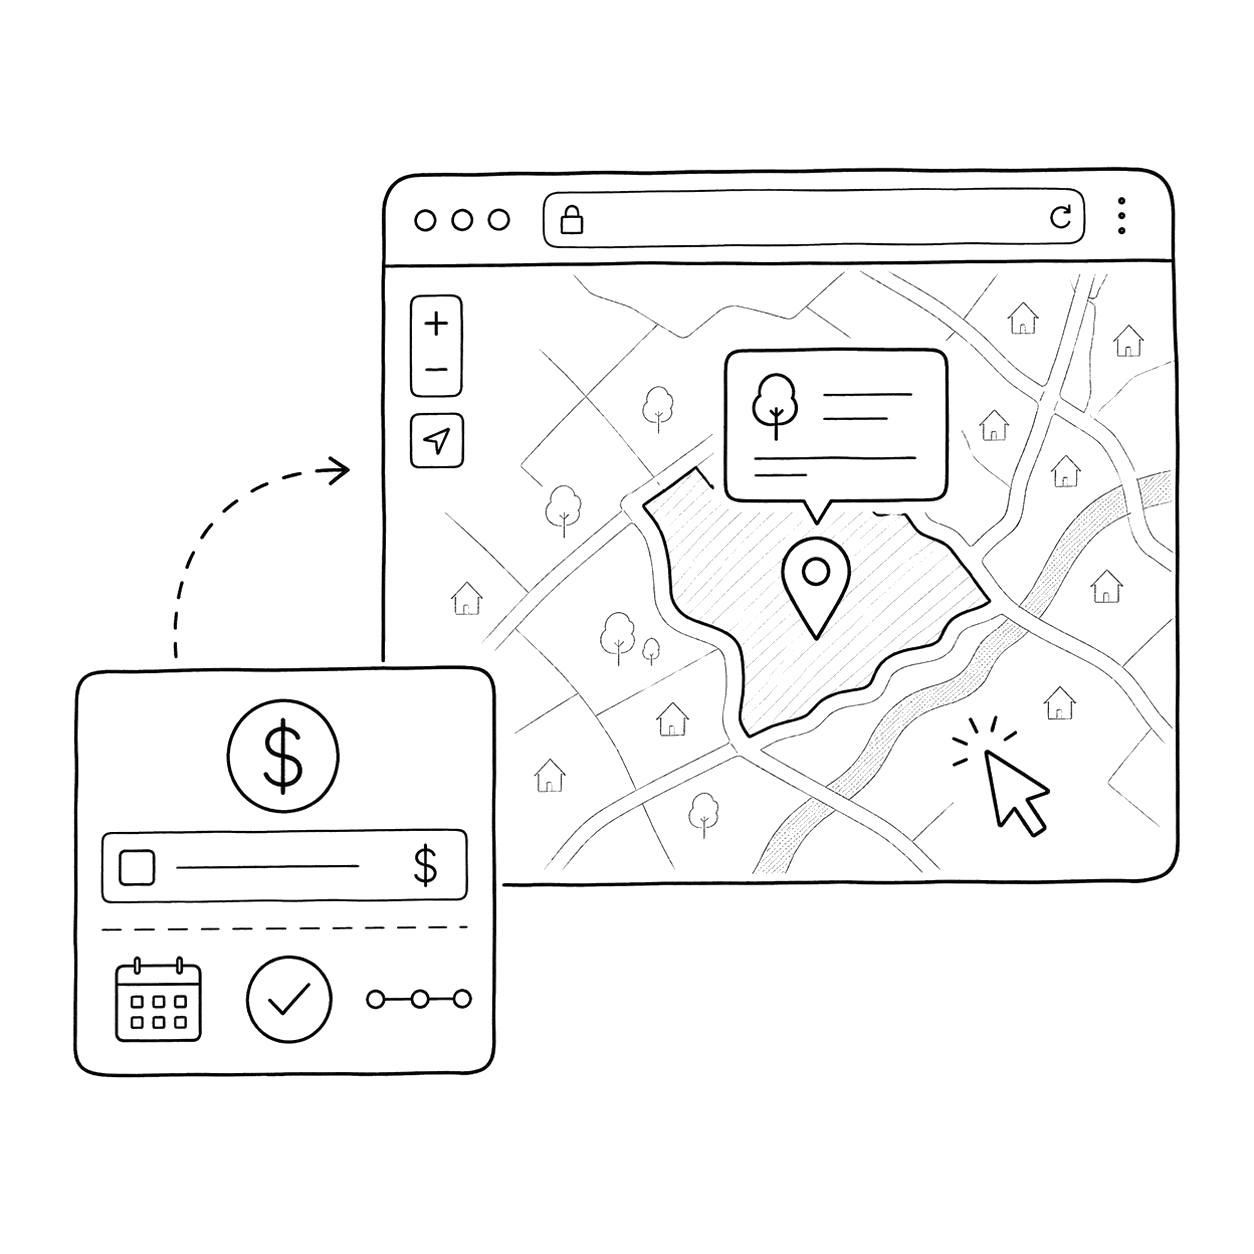
Send the link and step back. Stakeholders explore the map on their own, and the questions stop landing on your desk.
How does pricing work with grant-funded budgets?
Plans are fixed and predictable, so you can write the cost into a grant budget and not get surprised mid-project. No metered usage, no charges that move once the work is underway.
Is it really no-code, even though I am technical?
Yes. You build and publish the portal without writing code or standing up a server, which keeps your time on the analysis and the fieldwork rather than the web stack.
Does it work with drone and remote sensing data?
Yes. Bring in your drone imagery and the layers you produce from your remote sensing and field work, then publish them as a portal funders and clients can open. The heavy processing stays in your own tools. Mango is where the finished map goes online.
Will non-technical stakeholders actually understand the portal?
Funders, clients, and community members open a link and explore the map on any device, with no login or GIS software. Making the work legible to them is the whole reason to publish it this way.
How fast can I publish against a deadline?
From data to a live portal in hours or days, not weeks. Import, style, publish. No build queue, no bottleneck.
Does it support long-term projects with ongoing updates?
Yes. Refresh the portal with new drone flights, field observations, or research as the project runs. The published map reflects the update, so it stays current across the funding period.
Do I still need my desktop GIS?
Yes, and that is fine. Your analysis stays in the tools you know. Mango is the publishing layer that gets the finished map online for the people who do not have GIS software.
Everything between the data and the link.
Vector and Raster Support
Shapefile, MapInfo Tab, KML, CSV, FileGeodatabase, GeoJSON, and GeoTIFF. Bring your vector layers and your drone imagery alike.
Ask Your Data Anything
Build powerful filters on any field - without writing a line of SQL.
Advanced Symbology Builder
Thematic, category, heatmap, and custom graphic styles. Built once, reused across every map.
Share with Anyone
Public links for clients, login-required links for internal audiences. You decide who sees what.
Fully Branded Maps
Custom domain, logo, and colours, so every map you publish looks like it came from you, not us.
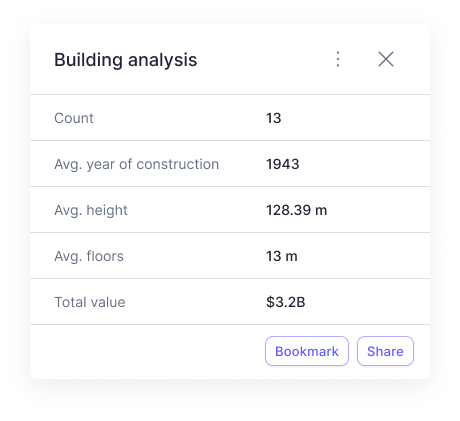
Spatial Analysis
Proximity, buffer, and intersection. Run the analyses your clients need without opening desktop GIS software.
Get your environmental maps off the PDF and in front of funders
Bring drone imagery, field data, and open sources into one portal funders and clients open in a browser. No developer, no server, and pricing that fits a grant budget.